Created by Silvie Cinková
STŘEDA 16:15 - 17:45
PÁTEK 13:45 - 15:15
Na kanálu Erko
"Code of conduct"
Welcome!
This is a course for REAL beginners. If you have coded before, it is ultimately going to be too slow for you. If you have not, this course is going to be very demanding for you. IT IS EXACTLY YOU THIS COURSE IS FOR. Never surrender to frustration, if everybody seems brighter than you. If they do, they are probably false beginners and have already gone through the very hell before you!
Like at a yoga studio, here is no place for your ego. Stay on your mat, be polite and discrete to others. Concentrate on yourself understanding the matter.
Interrupt teacher. Ask. ASK!!! ASK!!! There is nothing like a silly question. Often you don't understand because the teacher's presentation is confusing, or the stuff is just not logical. A particularly good question is: "Could you repeat what you said since this...."? There were FOR SURE others who should have asked, but you were the only one who dared.
Let the competence seep in with time. The next two months, you will hardly believe you can learn it. You may be doing poorly the entire term, but if you don't stop, the thing will give in.
Silvie Cinková is inviting you to a scheduled Zoom meeting.
Topic: Erko 2021
Time: Feb 26, 2021 09:00 AM Budapest
Join Zoom Meeting
https://cuni-cz.zoom.us/j/96459184606?pwd=UURobkxmTUVSTHB5Q09TVEEvYUI5dz09
Meeting ID: 964 5918 4606
Passcode: erko
//////////////
Silvie's personal room on Zoom
https://cuni-cz.zoom.us/j/9293605462?pwd=cnl5MkdURHBMK0R1R0Y3aHExUGJ2dz09
Meeting ID: 929 360 5462
Passcode: CzADH
Fixed consultation hours on Zoom (drop me an e-mail or text/call 723 464 449 if Zoom happens to be off)
Tentative plan: 2 fixed terms a week
Please vote here:
https://doodle.com/poll/msyrtv3cnu7gfz6m?utm_source=poll&utm_medium=link
You have been invited. Try to join or tell Silvie to add you, if you think you have not been invited. To be allowed to join the channel, you MUST have a zoom account (even a free subscription is ok). The invitation must must match the e-mail address associated with your zoom account.
not only R!
You have a 6-month free access to the entire content of DataCamp!
After that, you are going to fall back to free access (almost nothing accessible), but your account with all your earned xp points will not disappear (at least not immediately).
2 parts: Welcome word + Data Science in Digital Humanities
Videos might require a shibboleth login at https://stream.cuni.cz.
Objectives:
Additional random exercises to many courses if you think you need to train more.
Icon in the upper right corner
https://www.orgpad.com/s/Xc0Z4xJQjxN
Video in Czech below. If this does not work, you will have to log in at https://stream.cuni.cz, using CUNI Shibboleth (only available to CUNI affiliates). If you are logged in there, try this link directly: https://stream.cuni.cz/cs/Detail/11892 (that should take you directly to the video)
... and some others, not important here
https://campus.datacamp.com/courses/free-introduction-to-r/chapter-1-intro-to-basics-1?ex=1
finish
https://campus.datacamp.com/courses/free-introduction-to-r/chapter-2-vectors-2?ex=1
When you dont know how to code something, go look or even ask at https://stackoverflow.com/
https://campus.datacamp.com/courses/free-introduction-to-r/chapter-2-vectors-2?ex=1
Type ? followed with the name of function you want to know more about, e.g. ?tolower
https://jupyter.korpus.cz/r/auth-sign-in
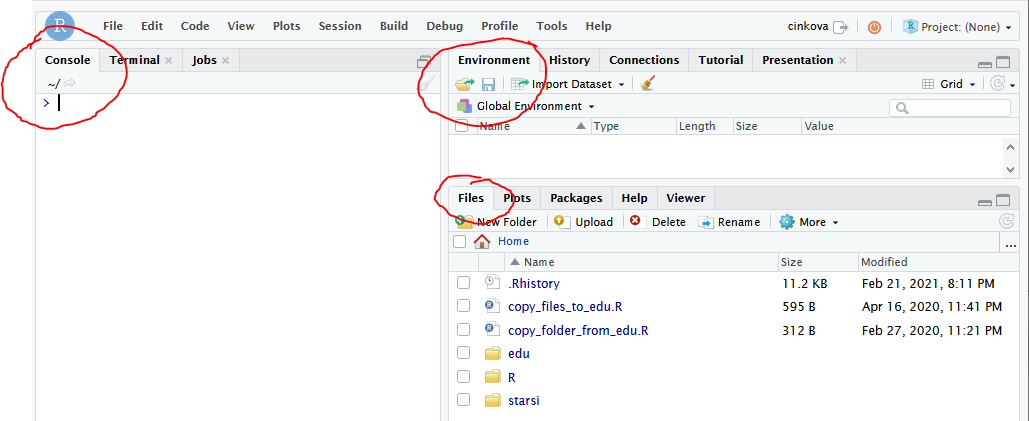
The first thing for you to see:
library(tidyverse)
library(stringi)
radky <- c("rozkošný chlapeček", "koště a pytel hraček",
"1 oko štěstí čeká", "sošný čekatel")
stringr::str_detect(string = radky, pattern = "[^k]oš.+ček")
#co ten vyraz najde?
stringr::str_extract(string = radky, pattern = "[^k]oš.+ček")
online book ggplot2 Elegant Graphics for Data Analysis by H. Wickham
Big picture, Data, Aesthetics, scale_nn_
https://learn.datacamp.com/courses/introduction-to-data-visualization-with-ggplot2
TWO WEEKS' TIME, NEXT SESSION COMES ON EASTER
Factors
https://campus.datacamp.com/courses/free-introduction-to-r/chapter-4-factors-4?ex=1
Data Frames
https://campus.datacamp.com/courses/free-introduction-to-r/chapter-5-data-frames?ex=1
Intro to dplyr: https://campus.datacamp.com/courses/introduction-to-the-tidyverse/data-wrangling-1?ex=1
Grouping and summarizing in dplyr: https://campus.datacamp.com/courses/introduction-to-the-tidyverse/grouping-and-summarizing?ex=1
Intro to ggplot2: https://campus.datacamp.com/courses/introduction-to-the-tidyverse/data-visualization?ex=1
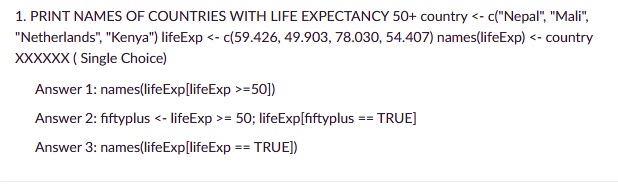
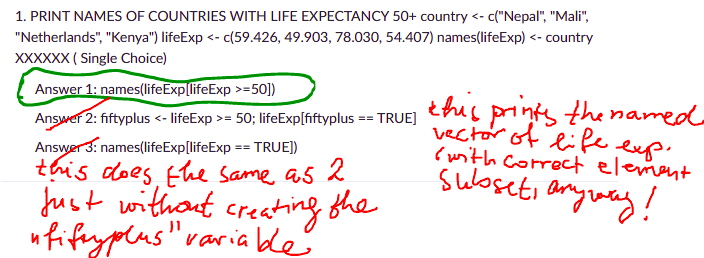
1. How would you best test which values in Vector my_vector are NA? ( Single Choice)
Answer 1: my_vector == NA
Answer 2: my_vector = NA
Answer 3: is.na(my_vector)
correct: is.na(my_vector)
my_vector == NA could occasionally work but never do that.
https://learn.datacamp.com/courses/introduction-to-data-visualization-with-ggplot2
TWO WEEKS' TIME, NEXT SESSION COMES ON EASTER
https://stream.cuni.cz/gotoken/d6dac592ad48406d9471dd86bf9205c9
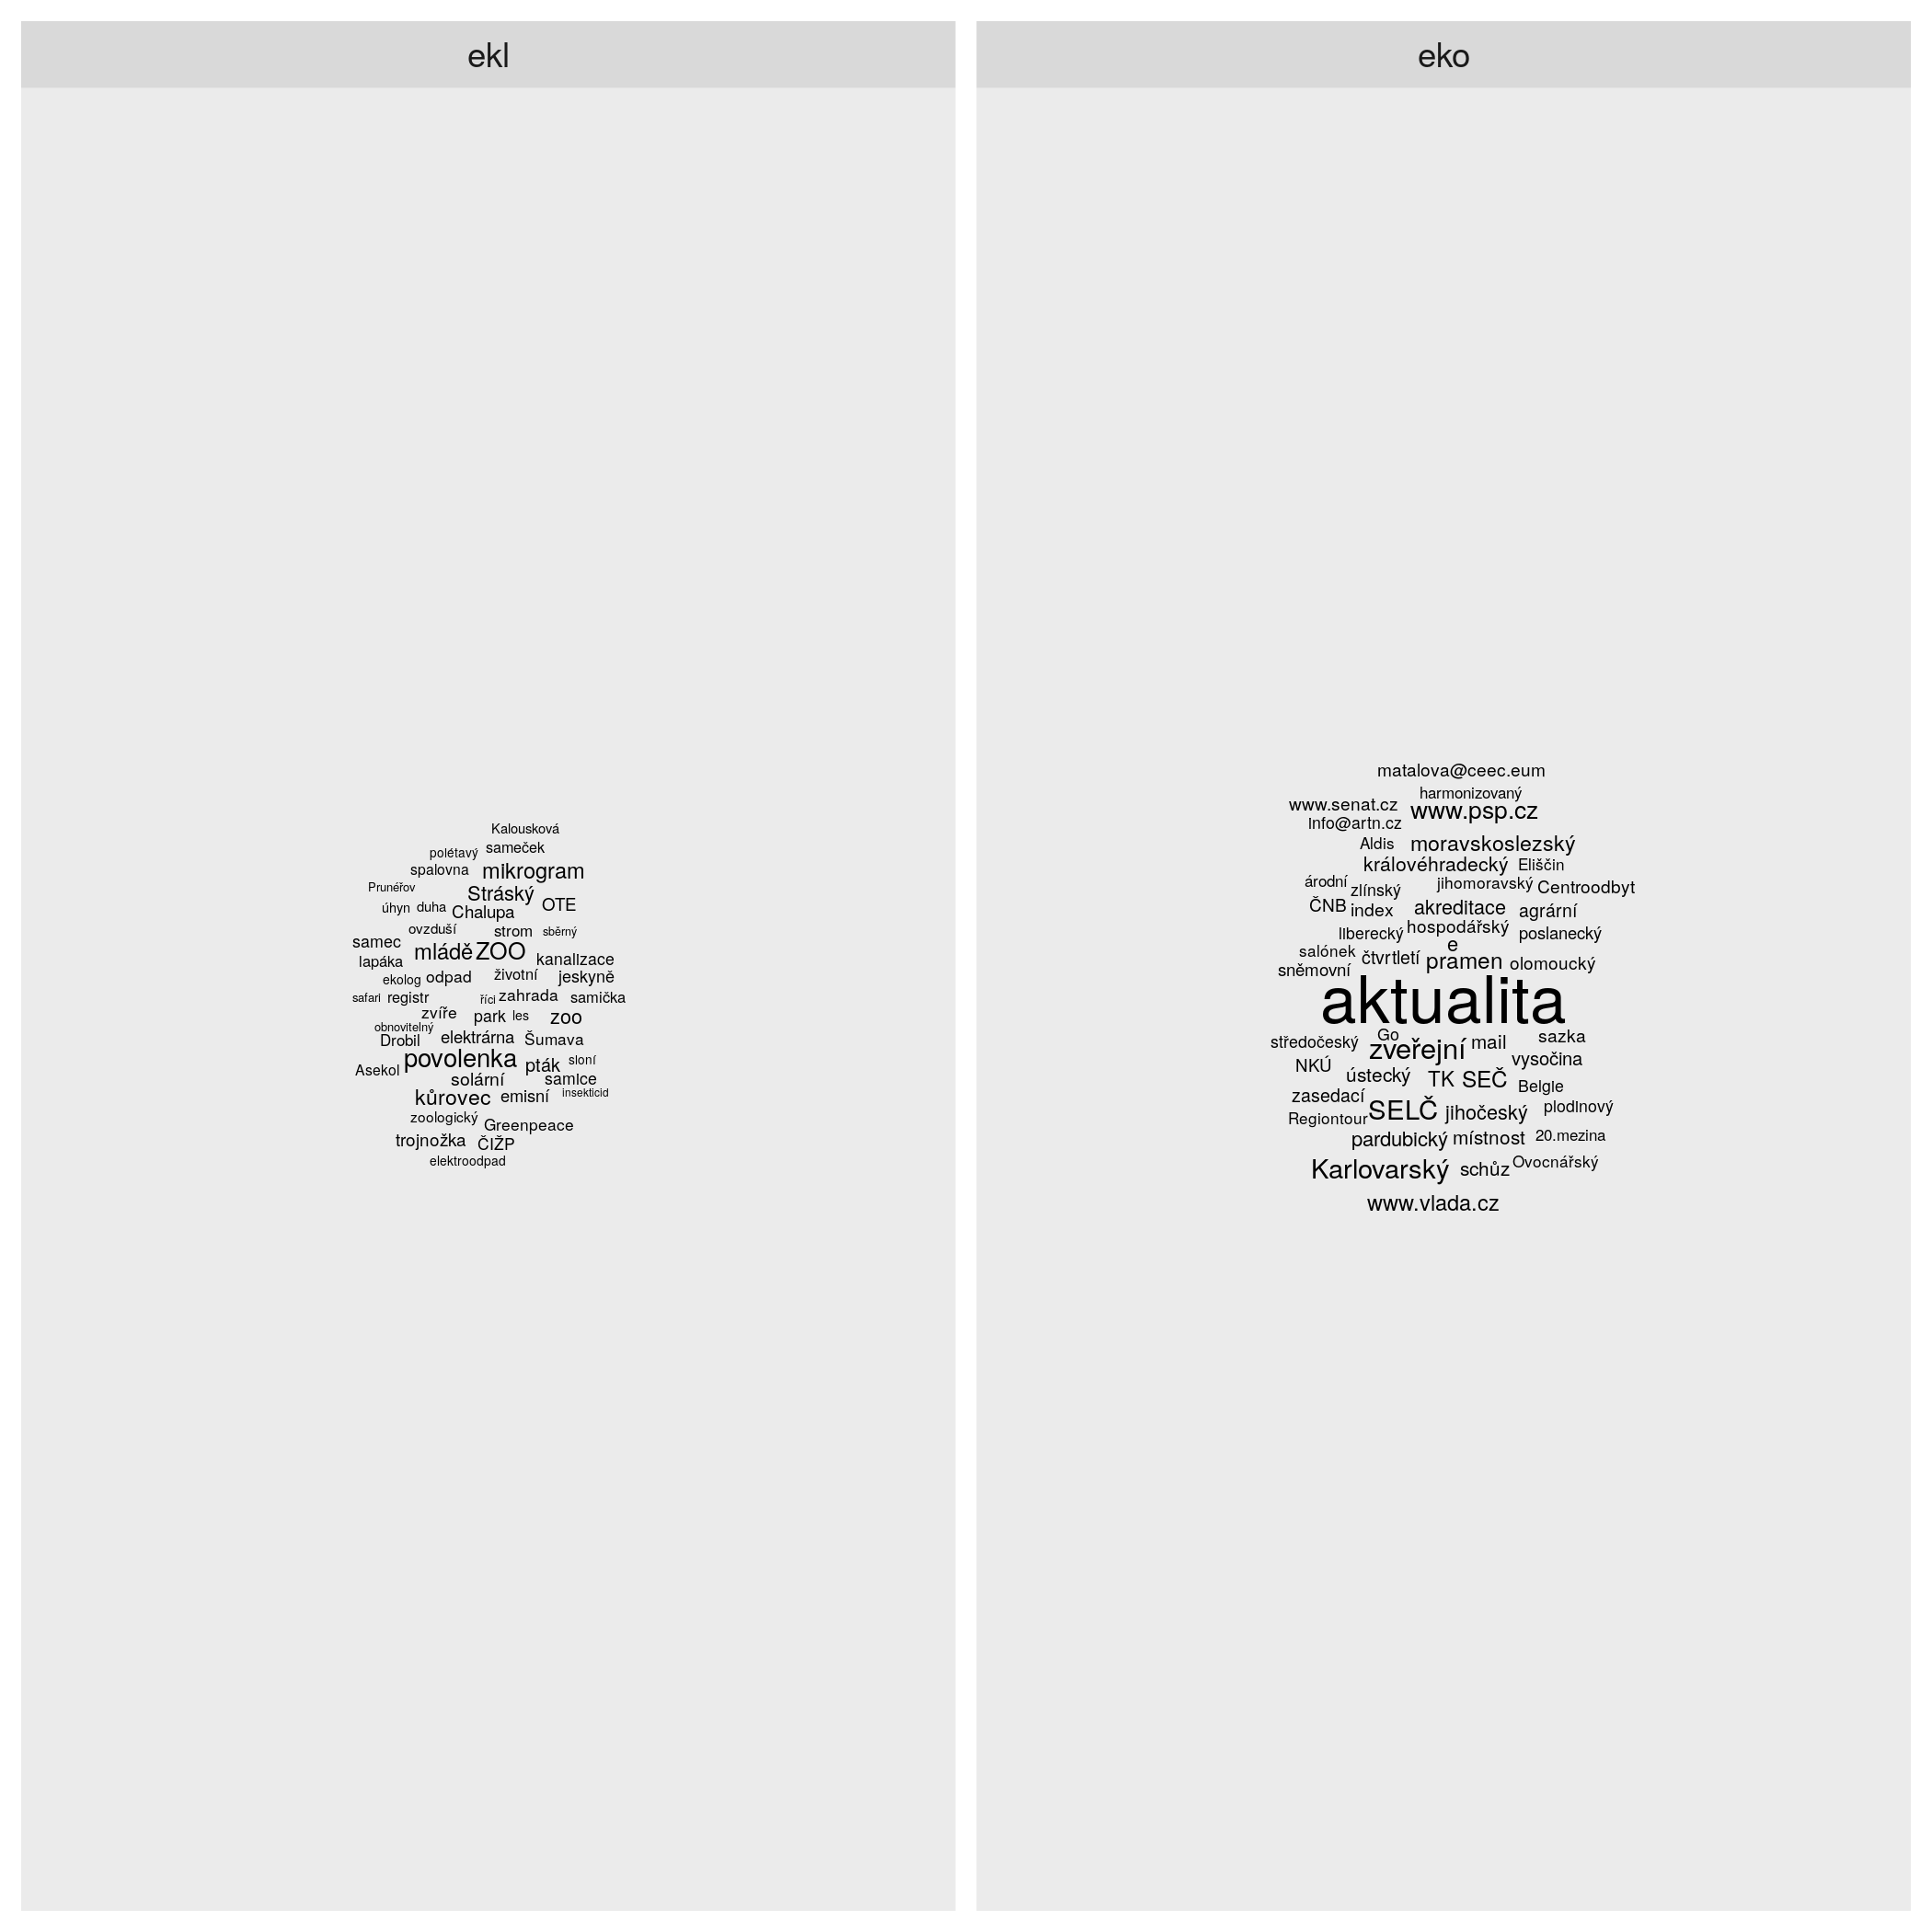
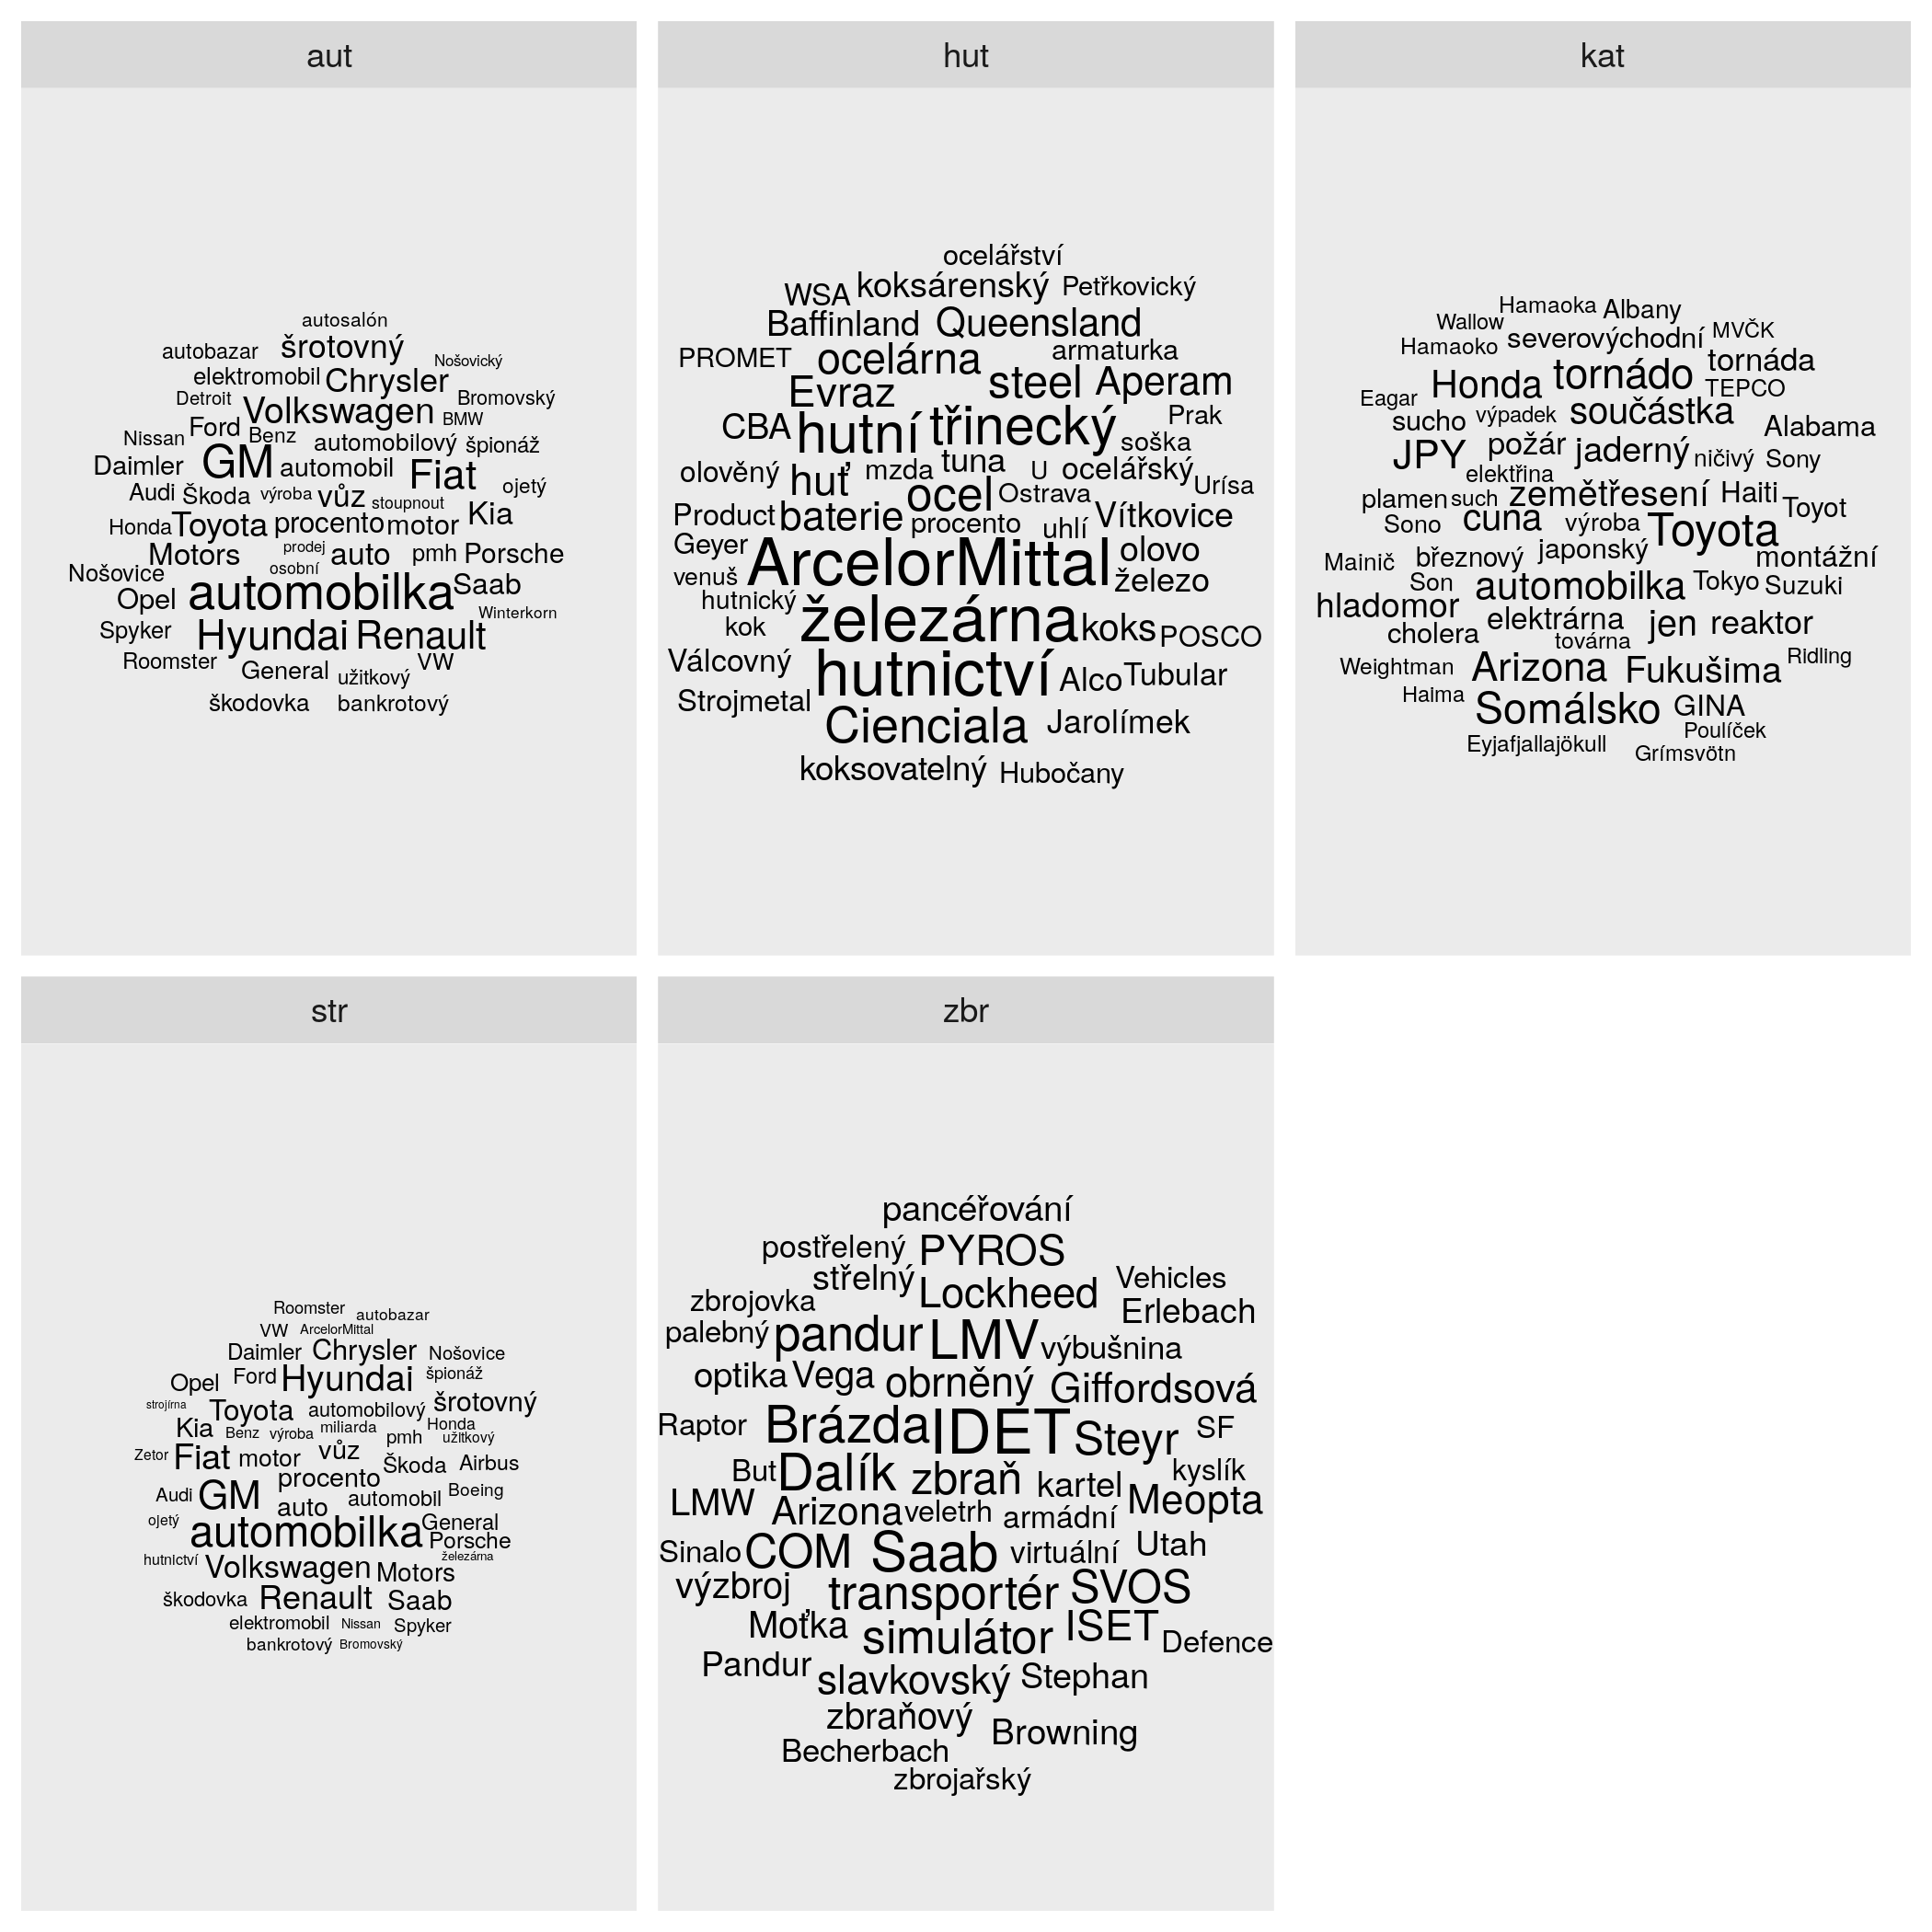
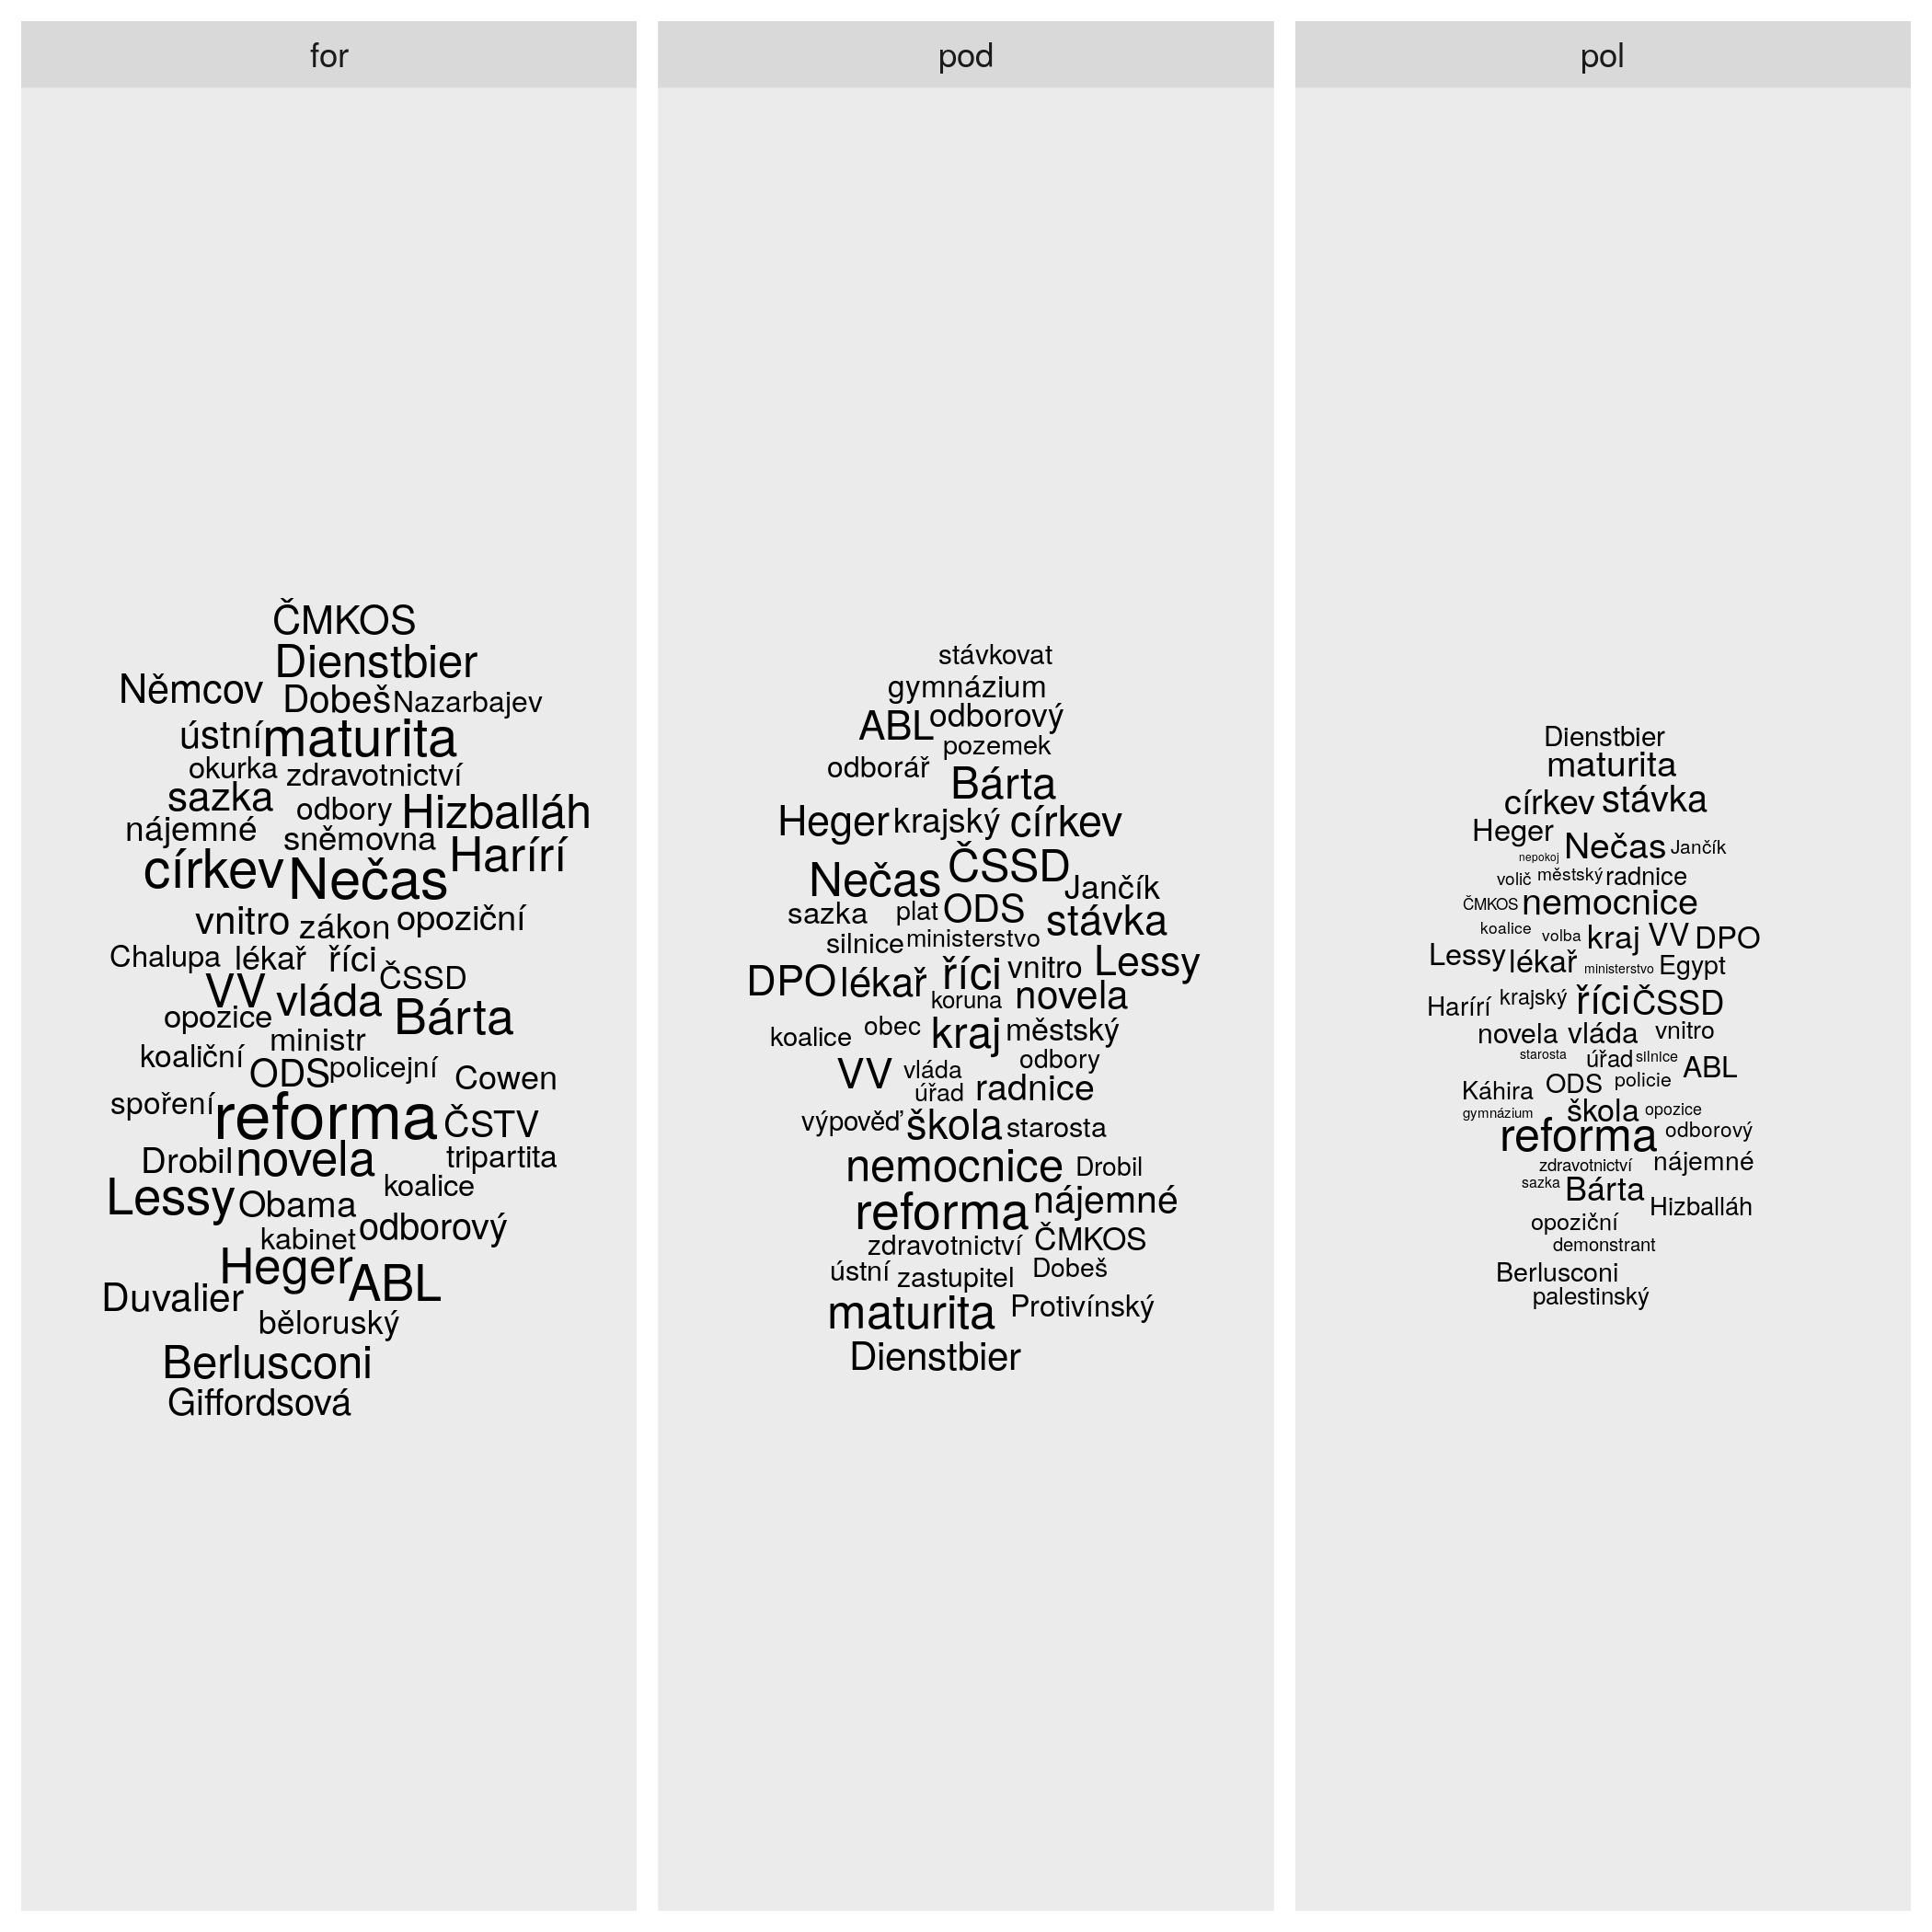
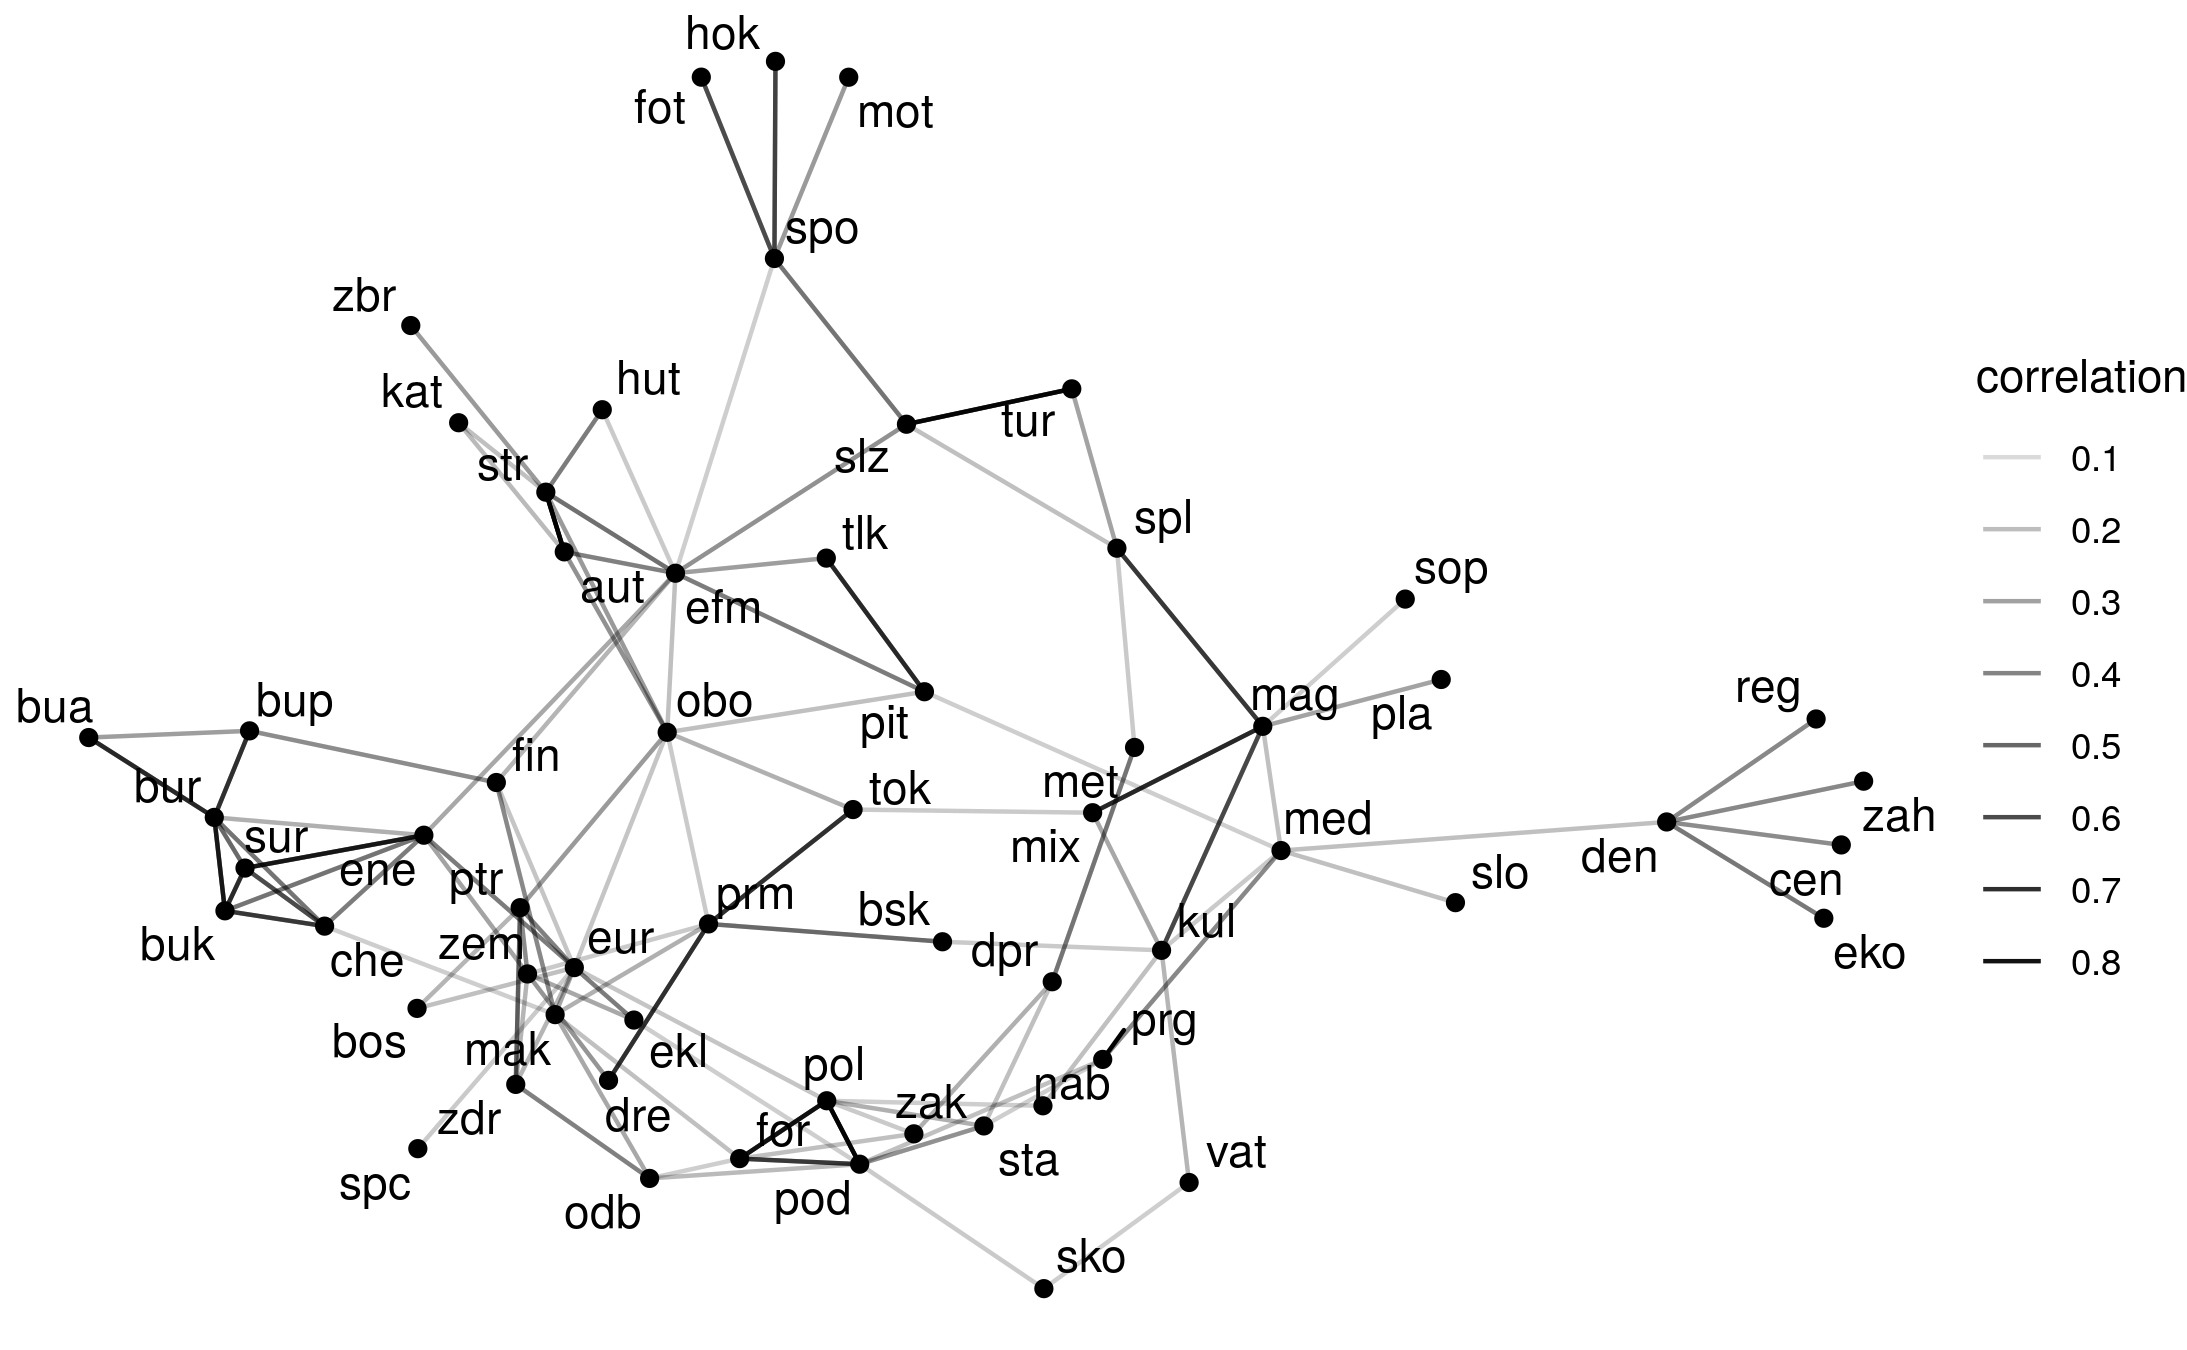
In this lecture, we worked with the dataset described in this paper. The students did not have to read the paper before the lecture, but it may be useful or interesting.
http://www.lrec-conf.org/proceedings/lrec2018/pdf/671.pdf
The script is on Jupyter in Home/edu/r/2021DataSciEdu/Session3
and for download here![]() Session3.zip
Session3.zip
It includes some of the poll exercises, too.
https://www.orgpad.com/s/lyr3VmxQMxg
https://stream.cuni.cz/gotoken/d7b9013c068946858f42e41705965694
https://learn.datacamp.com/courses/introduction-to-data-visualization-with-ggplot2
STATS Chapter from Intermediate visualization with ggplot2, to April 16
https://stream.cuni.cz/gotoken/0eaaa7183d7e402b9c9f6eafe75dfa4b
Poll 5 - after the Second lesson:
How do you feel about the pace?
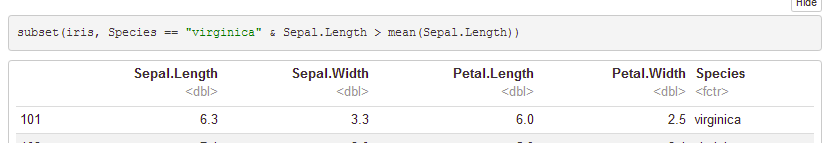
Note how arguments are written inside these functions: seldom in quotes and hardly ever in vectors. This would not be possible in most base-R functions!
https://stream.cuni.cz/gotoken/e6e6e90b1fd740ba8223570e35ab1b8b
https://stream.cuni.cz/gotoken/000b1f40ed194fe9a63a506450a1b775
https://stream.cuni.cz/gotoken/cc5b065910d644f8a7dd7ec69a3696ed
library(tidyverse)
library(magrittr)
library(gapminder)
#Pipe
#More readable code
#- avoids nested functions and too many variables between the steps
#- makes it easy to add steps in the middle of the code
#Magrittr offers several pipe types, but to use the basic one %>%, you do not
#have to load magrittr. It is included in dplyr.
#Too many variables Example
my_gap <- gapminder
gap_asia44 <- filter(gapminder, continent == "Asia", year == "1952")
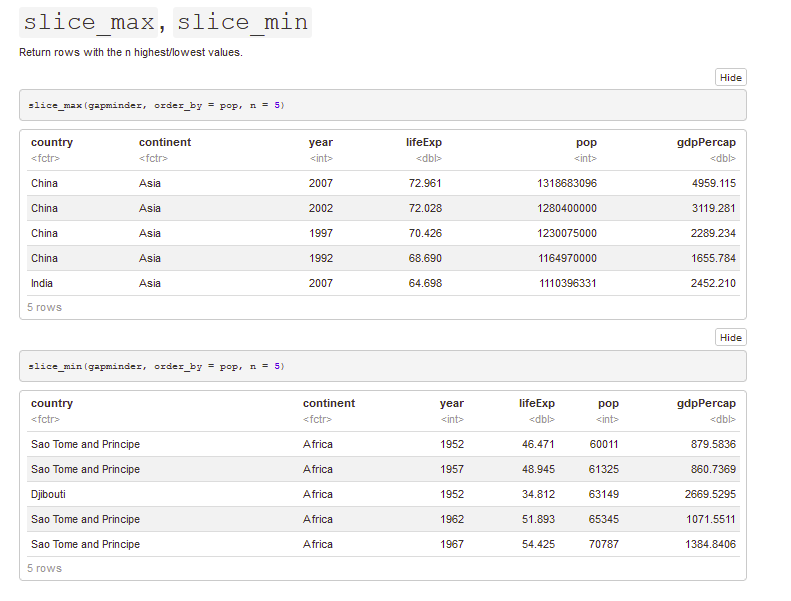
gap_asia44 <- slice_max(gap_asia44, order_by = pop, n = 5) #gives rows with 5 highest values of that variable
#Nested functions Example (you need fewer variables, but...)
top5pop2 <- slice_max(filter(gapminder, continent == "Asia",
year == "1952"),
order_by = pop, n = 5)
#Pipe
top5pop2 <- gapminder %>%
filter(continent == "Asia", pop > mean(.$pop))
![]() facets_coord_themes_shortcuts.Rmd
facets_coord_themes_shortcuts.Rmd
1. Which function(s) would you use to add rows to a data frame/tibble? (look them up in Help if you don't know) ( Multiple Choice)
Answer 1: rbind()
Answer 2: dplyr::bind_rows()
Answer 3: cbind()
Answer 4: row.names()
Correct 1 and 2
https://stream.cuni.cz/gotoken/99de0800e06c44fc8f6fda78dbb64feb
https://www.orgpad.com/s/lyr3VmxQMxg
https://stream.cuni.cz/gotoken/502bf2bb185b41f59e908a75982573aa
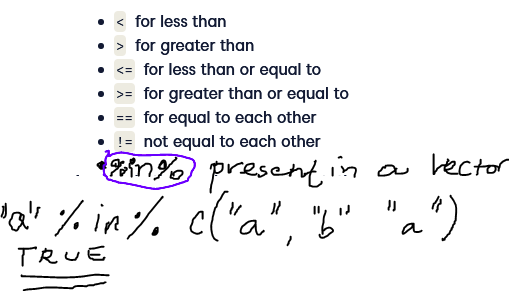
Relational operators you have already learned on DataCamp and one more added
,
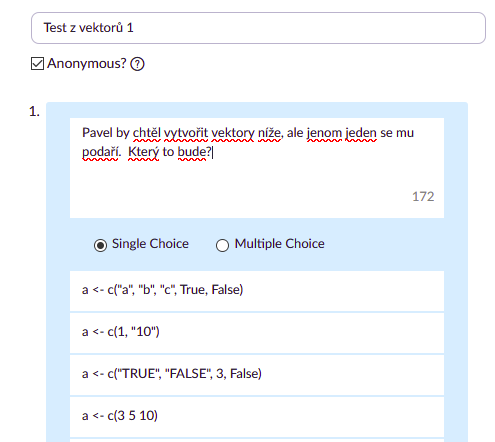
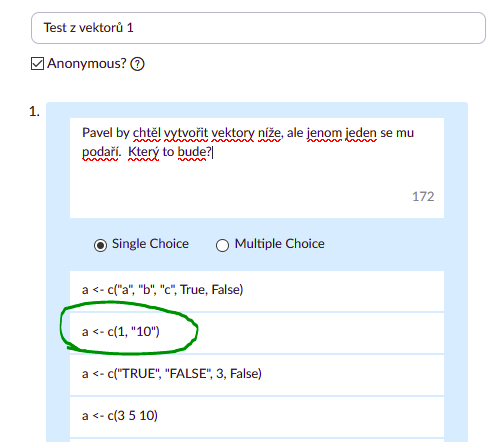
# Poll 2, Exercise 1
a <- c("a", "b", "c", TRUE, FALSE)
a <- c(1, "10") ##
a <- c("TRUE", "FALSE", 3, False)
a <- c(3 5 10)
#Poll 2, Exercise 2
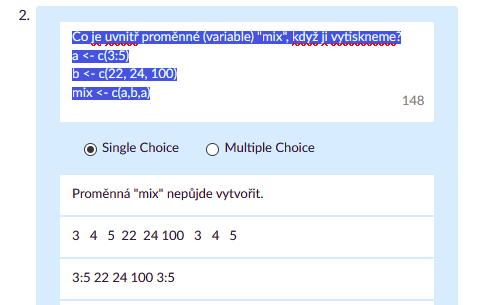
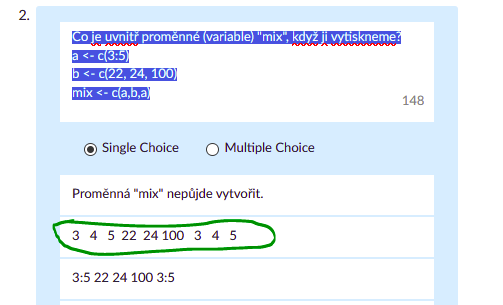
a <- c(3:5)
b <- c(22, 24, 100)
mix <- c(a,b,a)
mix
R eplace the NA values in `my_tibble$first_name` with the elements of the vector `missing_fistnames`.
```{r}
library(tidyverse)
library(gapminder)
```
Data frame
```{r}
my_tibble <- tibble(first_name = c("Božena", NA, NA, "Karolina", NA),
surname = c("Němcová", "Seifert", "Vančura", "Světlá", "Neruda"))
missing_firstnames <- c("Jaroslav", "Vladimír", "Jan") #You can trust that
# they are in correct order
```
```{r}
my_tibble
```
Now, replace the NA values in `my_tibble$first_name` with the elements of the vector `missing_fistnames`.
---
title: "SOLUTION Add values where they are missing"
output: html_notebook
---
```{r}
library(tidyverse)
library(gapminder)
```
Data frame
```{r}
my_tibble <- tibble(first_name = c("Božena", NA, NA, "Karolina", NA),
surname = c("Němcová", "Seifert", "Vančura", "Světlá", "Neruda"))
missing_firstnames <- c("Jaroslav", "Vladimír", "Jan") #You can trust that
# they are in correct order
```
```{r}
my_tibble
```
```{r}
missing_firstnames
```
#How would you insert these first_names into `my_tibble`?
You do not have to care how the rows will be arranged.
## First solution
```{r}
my_tibble$first_name[which(is.na(my_tibble$first_name))] <- missing_firstnames
```
```{r}
my_tibble
```
## Second solution
Data frame
```{r}
my_tibble <- tibble(first_name = c("Božena", NA, NA, "Karolina", NA),
surname = c("Němcová", "Seifert", "Vančura", "Světlá", "Neruda"))
missing_firstnames <- c("Jaroslav", "Vladimír", "Jan") #You can trust that
# they are in correct order
```
```{r}
toaddnames <- my_tibble %>% filter(is.na(first_name))
namesok <- my_tibble %>% filter(!is.na(first_name))
toaddnames$first_name <- missing_firstnames
my_tibble2 <- dplyr::bind_rows(namesok, toaddnames)
```
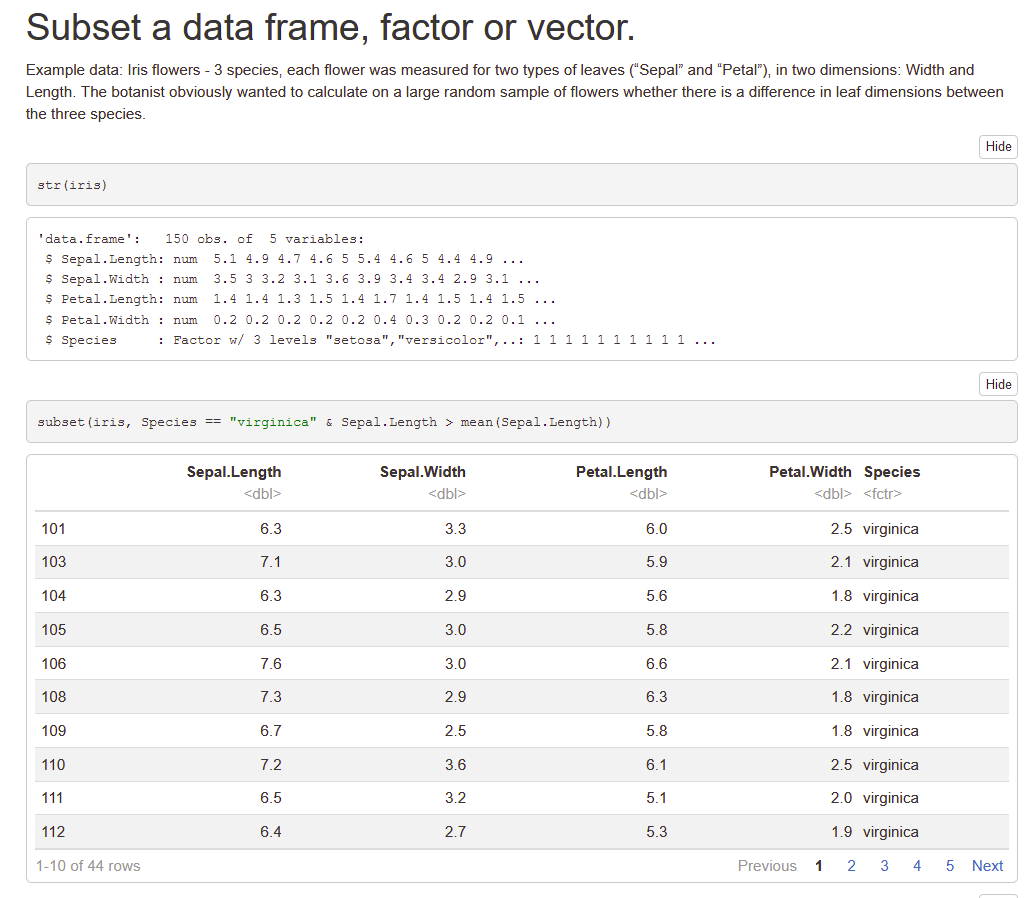
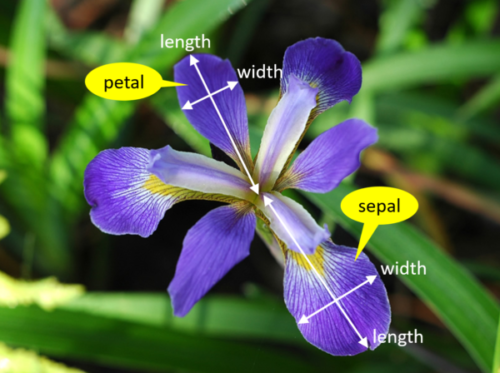
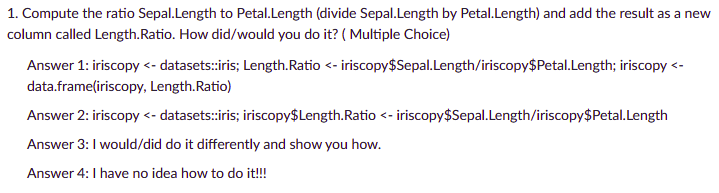
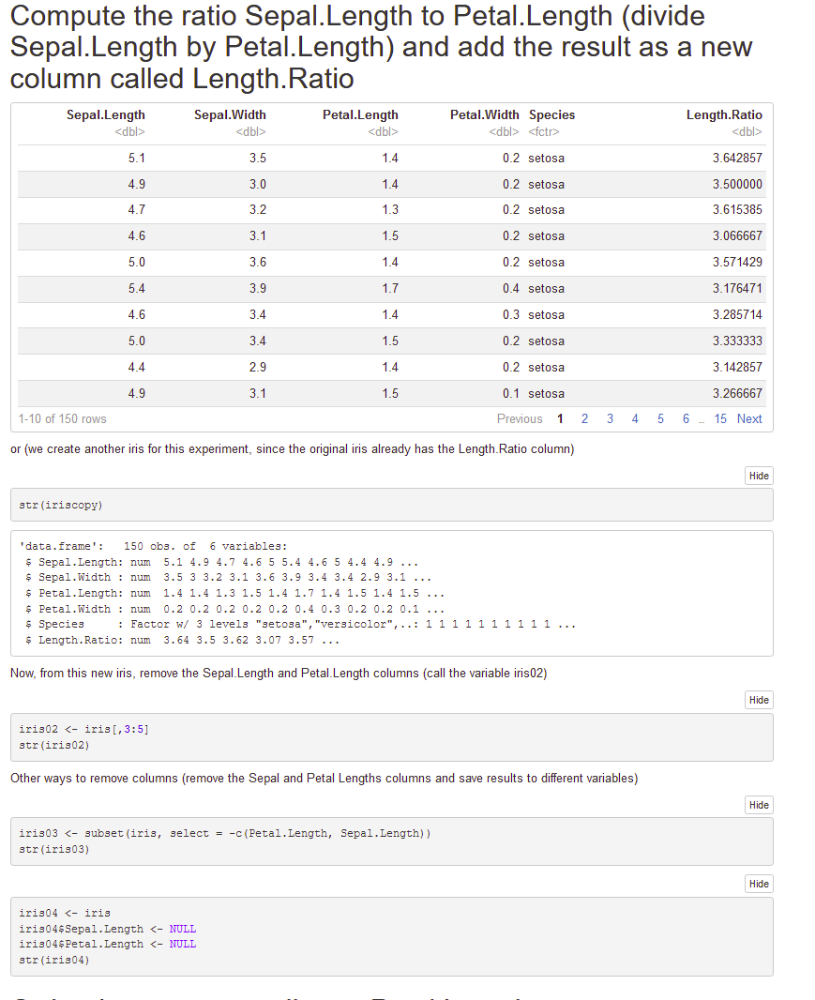
Compute the ratio Sepal.Length to Petal.Length (divide Sepal.Length by Petal.Length) and add the result as a new column called Length.Ratio
Asked11 years, 7 months ago Active2 months agoViewed 413k times
567
176
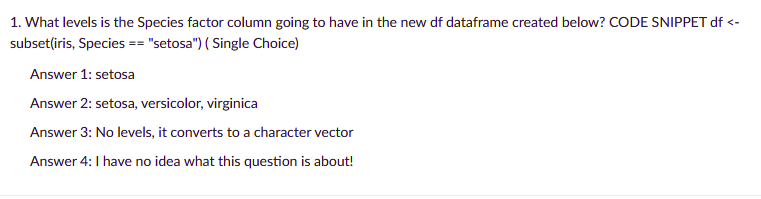
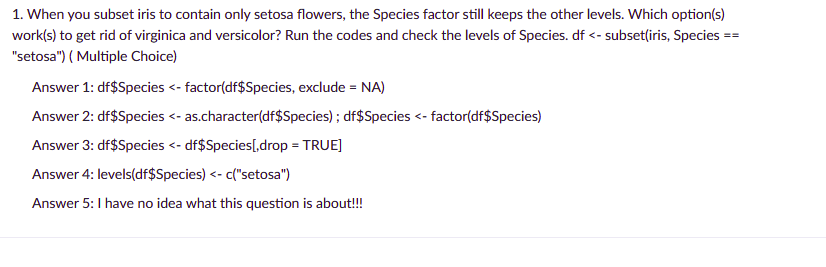
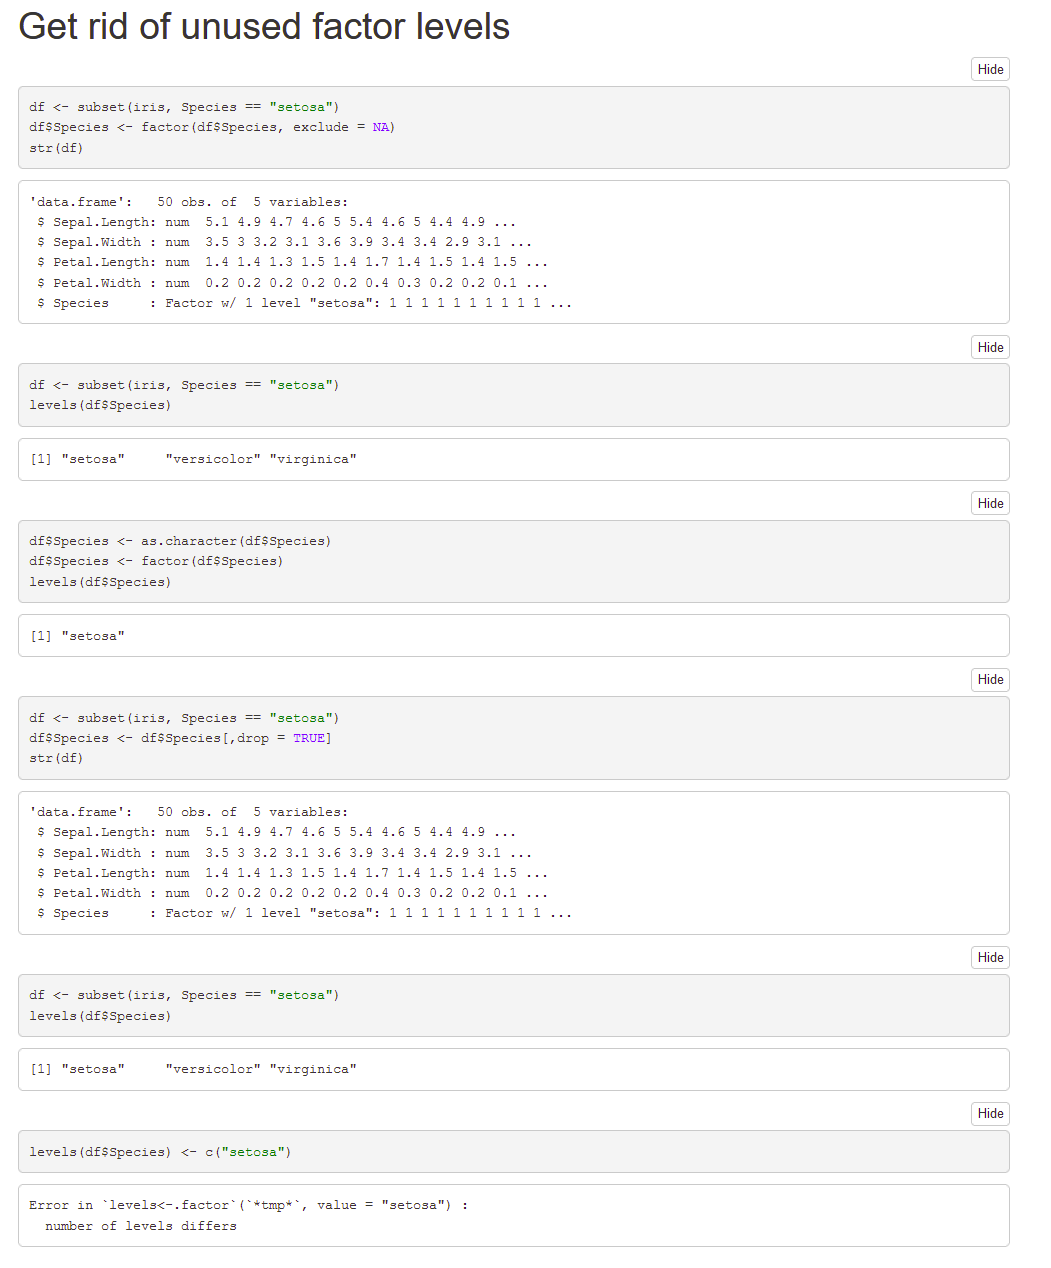
I have a data frame containing a factor. When I create a subset of this dataframe using subset or another indexing function, a new data frame is created. However, the factor variable retains all of its original levels, even when/if they do not exist in the new dataframe.This causes problems when doing faceted plotting or using functions that rely on factor levels.What is the most succinct way to remove levels from a factor in the new dataframe?Here's an example:
df <- data.frame(letters=letters[1:5], numbers=seq(1:5)) levels(df$letters) ## [1] "a" "b" "c" "d" "e" subdf <- subset(df, numbers <= 3) ## letters numbers## 1 a 1## 2 b 2## 3 c 3 # all levels are still there! levels(subdf$letters) ## [1] "a" "b" "c" "d" "e"r dataframe r-factor r-faqShareImprove this question Follow edited Jun 29 '20 at 23:26Henrik55.3k1212 gold badges124124 silver badges138138 bronze badges asked Jul 28 '09 at 18:21medriscoll24.4k1616 gold badges3535 silver badges3636 bronze badgesAdd a comment
439
All you should have to do is to apply factor() to your variable again after subsetting:
> subdf$letters [1] a b c Levels: a b c d e subdf$letters <- factor(subdf$letters) > subdf$letters [1] a b c Levels: a b cEDITFrom the factor page example:
factor(ff) # drops the levels that do not occurFor dropping levels from all factor columns in a dataframe, you can use:
subdf <- subset(df, numbers <= 3) subdf[] <- lapply(subdf, function(x) if(is.factor(x)) factor(x) else x)ShareImprove this answer Follow edited Nov 25 '16 at 17:37 answered Jul 28 '09 at 22:41hatmatrix36.1k3737 gold badges125125 silver badges215215 bronze badges
mydf <- droplevels(mydf) solution suggested by Roman Luštrik and Tommy O'Dell below is preferable. – JohanMay 9 '14 at 10:41
505
Since R version 2.12, there's a droplevels() function.
levels(droplevels(subdf$letters))ShareImprove this answer Follow answered Nov 26 '10 at 11:37
factor() is that it's not necessary to modify the original dataframe or create a new persistent dataframe. I can wrap droplevels around a subsetted dataframe and use it as the data argument to a lattice function, and groups will be handled correctly. – MarsNov 21 '15 at 5:44
47
If you don't want this behaviour, don't use factors, use character vectors instead. I think this makes more sense than patching things up afterwards. Try the following before loading your data with read.table or read.csv:
options(stringsAsFactors = FALSE)The disadvantage is that you're restricted to alphabetical ordering. (reorder is your friend for plots)ShareImprove this answer Follow answered Jul 28 '09 at 23:53hadley93.3k2626 gold badges169169 silver badges237237 bronze badgesAdd a comment
39
It is a known issue, and one possible remedy is provided by drop.levels() in the gdata package where your example becomes
> drop.levels(subdf) letters numbers 1 a 12 b 23 c 3 > levels(drop.levels(subdf)$letters) [1] "a" "b" "c"There is also the
dropUnusedLevels function in the Hmisc package. However, it only works by altering the subset operator [ and is not applicable here.As a corollary, a direct approach on a per-column basis is a simple as.factor(as.character(data)): > levels(subdf$letters) [1] "a" "b" "c" "d" "e" > subdf$letters <- as.factor(as.character(subdf$letters)) > levels(subdf$letters) [1] "a" "b" "c"ShareImprove this answer Follow edited Jul 28 '09 at 19:04 answered Jul 28 '09 at 18:37Dirk Eddelbuettel327k4949 gold badges591591 silver badges670670 bronze badges
reorder parameter of the drop.levels function is worth mentioning: if you have to preserve the original order of your factors, use it with FALSE value. – daroczigJan 17 '11 at 11:31
26
Another way of doing the same but with
dplyrlibrary(dplyr) subdf <- df %>% filter(numbers <= 3) %>% droplevels() str(subdf)Edit: Also Works ! Thanks to agenis
subdf <- df %>% filter(numbers <= 3) %>% droplevels levels(subdf$letters)ShareImprove this answer Follow edited May 23 '17 at 12:18Community♦111 silver badge answered Jul 15 '15 at 11:14Prradep4,59933 gold badges3333 silver badges6464 bronze badgesAdd a comment
17
For the sake of completeness, now there is also fct_drop in the forcats package http://forcats.tidyverse.org/reference/fct_drop.html.It differs from droplevels in the way it deals with NA:
f <- factor(c("a", "b", NA), exclude = NULL) droplevels(f) # [1] a b <NA># Levels: a b <NA> forcats::fct_drop(f) # [1] a b <NA># Levels: a bShareImprove this answer Follow answered Jun 12 '17 at 9:44
15
Here's another way, which I believe is equivalent to the factor(..) approach:
> df <- data.frame(let=letters[1:5], num=1:5) > subdf <- df[df$num <= 3, ] > subdf$let <- subdf$let[ , drop=TRUE] > levels(subdf$let) [1] "a" "b" "c"ShareImprove this answer Follow answered Jul 29 '09 at 3:40ars104k2121 gold badges133133 silver badges130130 bronze badges
`[.factor` method that has a drop argument and you've posted this in 2009... – David ArenburgFeb 13 '19 at 15:42
8
This is obnoxious. This is how I usually do it, to avoid loading other packages:
levels(subdf$letters)<-c("a","b","c",NA,NA) which gets you: > subdf$letters [1] a b c Levels: a b cNote that the new levels will replace whatever occupies their index in the old levels(subdf$letters), so something like:
levels(subdf$letters)<-c(NA,"a","c",NA,"b")won't work.This is obviously not ideal when you have lots of levels, but for a few, it's quick and easy.ShareImprove this answer Follow edited Jul 28 '09 at 19:06 answered Jul 28 '09 at 18:44
8
Looking at the droplevels methods code in the R source you can see it wraps to factor function. That means you can basically recreate the column with factor function. Below the data.table way to drop levels from all the factor columns.
library(data.table) dt = data.table(letters=factor(letters[1:5]), numbers=seq(1:5)) levels(dt$letters) #[1] "a" "b" "c" "d" "e" subdt = dt[numbers <= 3] levels(subdt$letters) #[1] "a" "b" "c" "d" "e" upd.cols = sapply(subdt, is.factor) subdt[, names(subdt)[upd.cols] := lapply(.SD, factor), .SDcols = upd.cols] levels(subdt$letters) #[1] "a" "b" "c"ShareImprove this answer Follow edited Mar 11 '16 at 23:30 answered Dec 9 '15 at 14:56
data.table way would be something like for (j in names(DT)[sapply(DT, is.factor)]) set(DT, j = j, value = factor(DT[[j]])) – David ArenburgJan 24 '16 at 13:24[.data.table only once – jangoreckiNov 30 '16 at 13:25
7
here is a way of doing that
varFactor <- factor(letters[1:15]) varFactor <- varFactor[1:5] varFactor <- varFactor[drop=T]ShareImprove this answer Follow edited Nov 9 '14 at 10:03
6
I wrote utility functions to do this. Now that I know about gdata's drop.levels, it looks pretty similar. Here they are (from here):
present_levels <- function(x) intersect(levels(x), x) trim_levels <- function(...) UseMethod("trim_levels") trim_levels.factor <- function(x) factor(x, levels=present_levels(x)) trim_levels.data.frame <- function(x) { for (n in names(x)) if (is.factor(x[,n])) x[,n] = trim_levels(x[,n]) x } ShareImprove this answer Follow answered Sep 1 '09 at 20:37Brendan OConnor8,95833 gold badges2424 silver badges2424 bronze badgesAdd a comment
4
Very interesting thread, I especially liked idea to just factor subselection again. I had the similar problem before and I just converted to character and then back to factor.
df <- data.frame(letters=letters[1:5],numbers=seq(1:5)) levels(df$letters) ## [1] "a" "b" "c" "d" "e" subdf <- df[df$numbers <= 3] subdf$letters<-factor(as.character(subdf$letters))ShareImprove this answer Follow answered May 25 '15 at 12:08
factor(as.chracter(...)) works, but just less efficiently and succinctly than factor(...). Seems strictly worse than the other answers. – Gregor ThomasFeb 13 '19 at 15:47
1
Unfortunately factor() doesn't seem to work when using rxDataStep of RevoScaleR. I do it in two steps: 1) Convert to character and store in temporary external data frame (.xdf). 2) Convert back to factor and store in definitive external data frame. This eliminates any unused factor levels, without loading all the data into memory.
# Step 1) Converts to character, in temporary xdf file: rxDataStep(inData = "input.xdf", outFile = "temp.xdf", transforms = list(VAR_X = as.character(VAR_X)), overwrite = T) # Step 2) Converts back to factor: rxDataStep(inData = "temp.xdf", outFile = "output.xdf", transforms = list(VAR_X = as.factor(VAR_X)), overwrite = T)ShareImprove this answer Follow answered Jan 28 '19 at 21:10
1
Have tried most of the examples here if not all but none seem to be working in my case. After struggling for quite some time I have tried using as.character() on the factor column to change it to a col with strings which seems to working just fine.Not sure for performance issues.ShareImprove this answer Follow answered Sep 2 '19 at 3:20Naga Pakalapati12311 silver badge55 bronze badgesAdd a comment
0
A genuine droplevels function that is much faster than droplevels and does not perform any kind of unnecessary matching or tabulation of values is collapse::fdroplevels. Example:
library(collapse) library(microbenchmark) # wlddev data supplied in collapse, iso3c is a factor data <- fsubset(wlddev, iso3c %!in% "USA") microbenchmark(fdroplevels(data), droplevels(data), unit = "relative") ## Unit: relative## expr min lq mean median uq max neval cld## fdroplevels(data) 1.0 1.00000 1.00000 1.00000 1.00000 1.00000 100 a ## droplevels(data) 30.2 29.15873 24.54175 24.86147 22.11553 14.23274 100 bShareImprove this answer Follow answered Jan 9 at 8:45
Highly active question. Earn 10 reputation in order to answer this question. The reputation requirement helps protect this question from spam and non-answer activity.
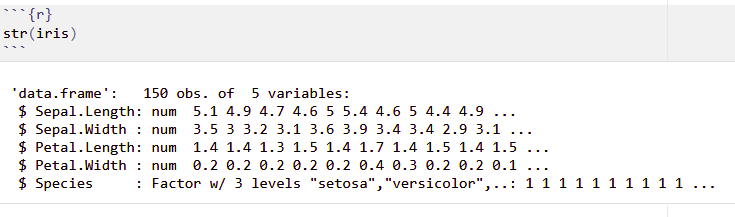
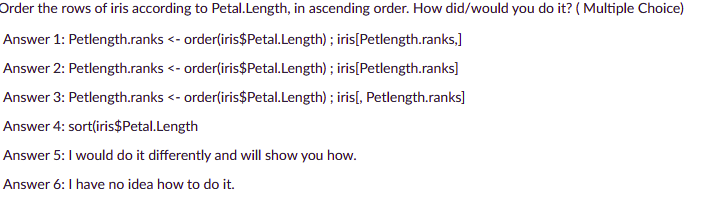
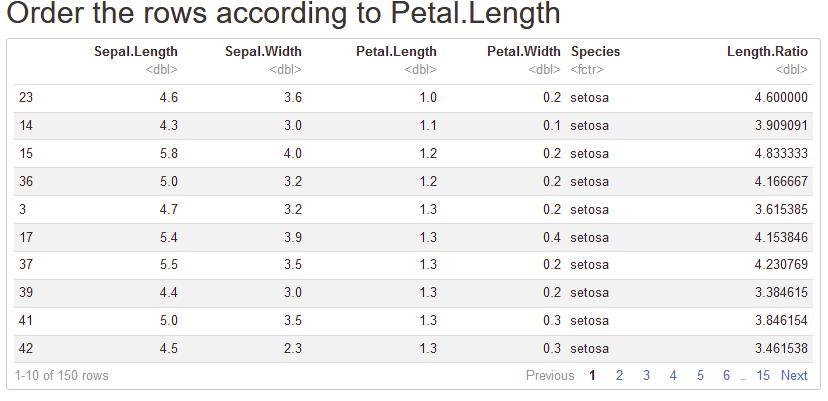
Order the rows of iris according to Petal.Length, in ascending order. How did/would you do it?
Cvičení 2
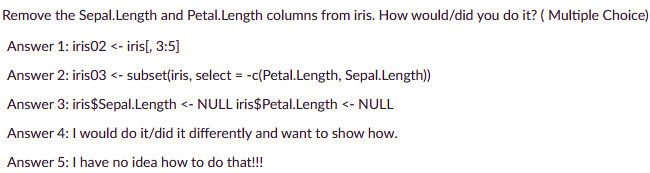
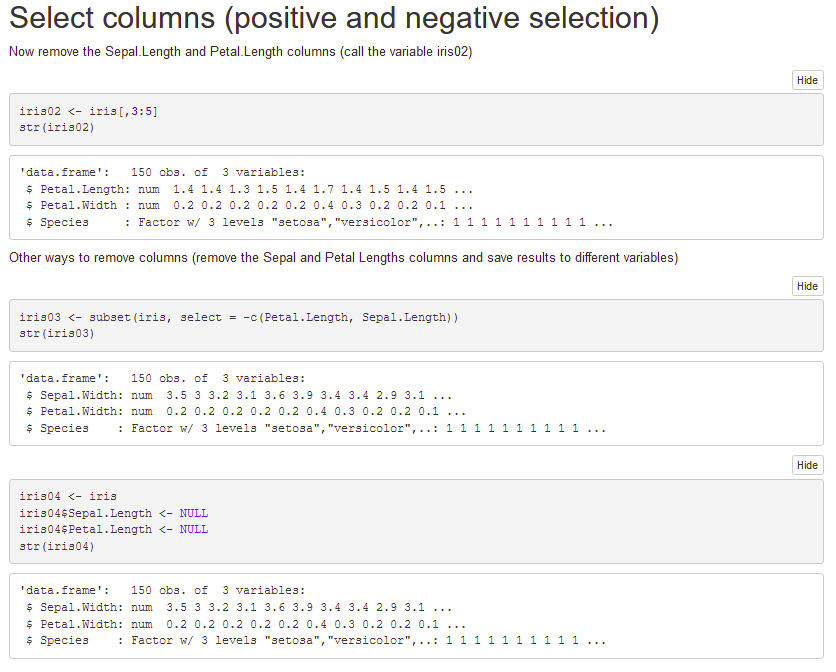
Remove the Sepal.Length and Petal.Length columns from iris
![]() pokusy.Rmd,
pokusy.Rmd, ![]() strings001.Rmd,
strings001.Rmd, ![]() strings01.Rmd,
strings01.Rmd,
![]() strings02.Rmd,
strings02.Rmd, ![]() jmenadeti_2019.xlsx,
jmenadeti_2019.xlsx, ![]() moje_jmena.tsv or all in one zipped archive here:
moje_jmena.tsv or all in one zipped archive here: ![]() stringr.zip
stringr.zip
https://stream.cuni.cz/gotoken/5b0fbad8173843c0a70ce0c72bd6d593